Methane In Atmosphere-How Tracking Really Works

- 01. How Methane Is Monitored in the Atmosphere
- 02. Core Physical Principles Behind Methane Detection
- 03. Satellite-Based Monitoring and Global Coverage
- 04. Ground-Based Sensors and Field Instruments
- 05. Aircraft and Drone-Borne Systems
- 06. Modeling and "Bottom-Up" versus "Top-Down" Approaches
- 07. Real-World Detection Limits and Performance Benchmarks
- 08. Alert Systems and Operational Response
- 09. Challenges and Limitations in Current Monitoring
- 10. Emerging Innovations and Next-Generation Systems
- 11. Uses of Methane Monitoring Data in Policy and Industry
- 12. Practical Examples of Monitoring in Action
- 13. Key Takeaways for Stakeholders
How Methane Is Monitored in the Atmosphere
Atmospheric methane monitoring relies on a layered toolkit that combines satellites, aircraft, ground sensors, and analytical models to detect, quantify, and track emissions over time. These systems measure methane by exploiting how it absorbs specific wavelengths of infrared light, then convert those signals into concentration maps and emission-rate estimates at scales from individual well pads to entire continents. Since the late 2010s, advances in satellite spectrometers, drone-borne lidar, and networks of ground-based sensors have turned methane from a diffuse climate wildcard into a targetable pollutant with near-real-time alerts.
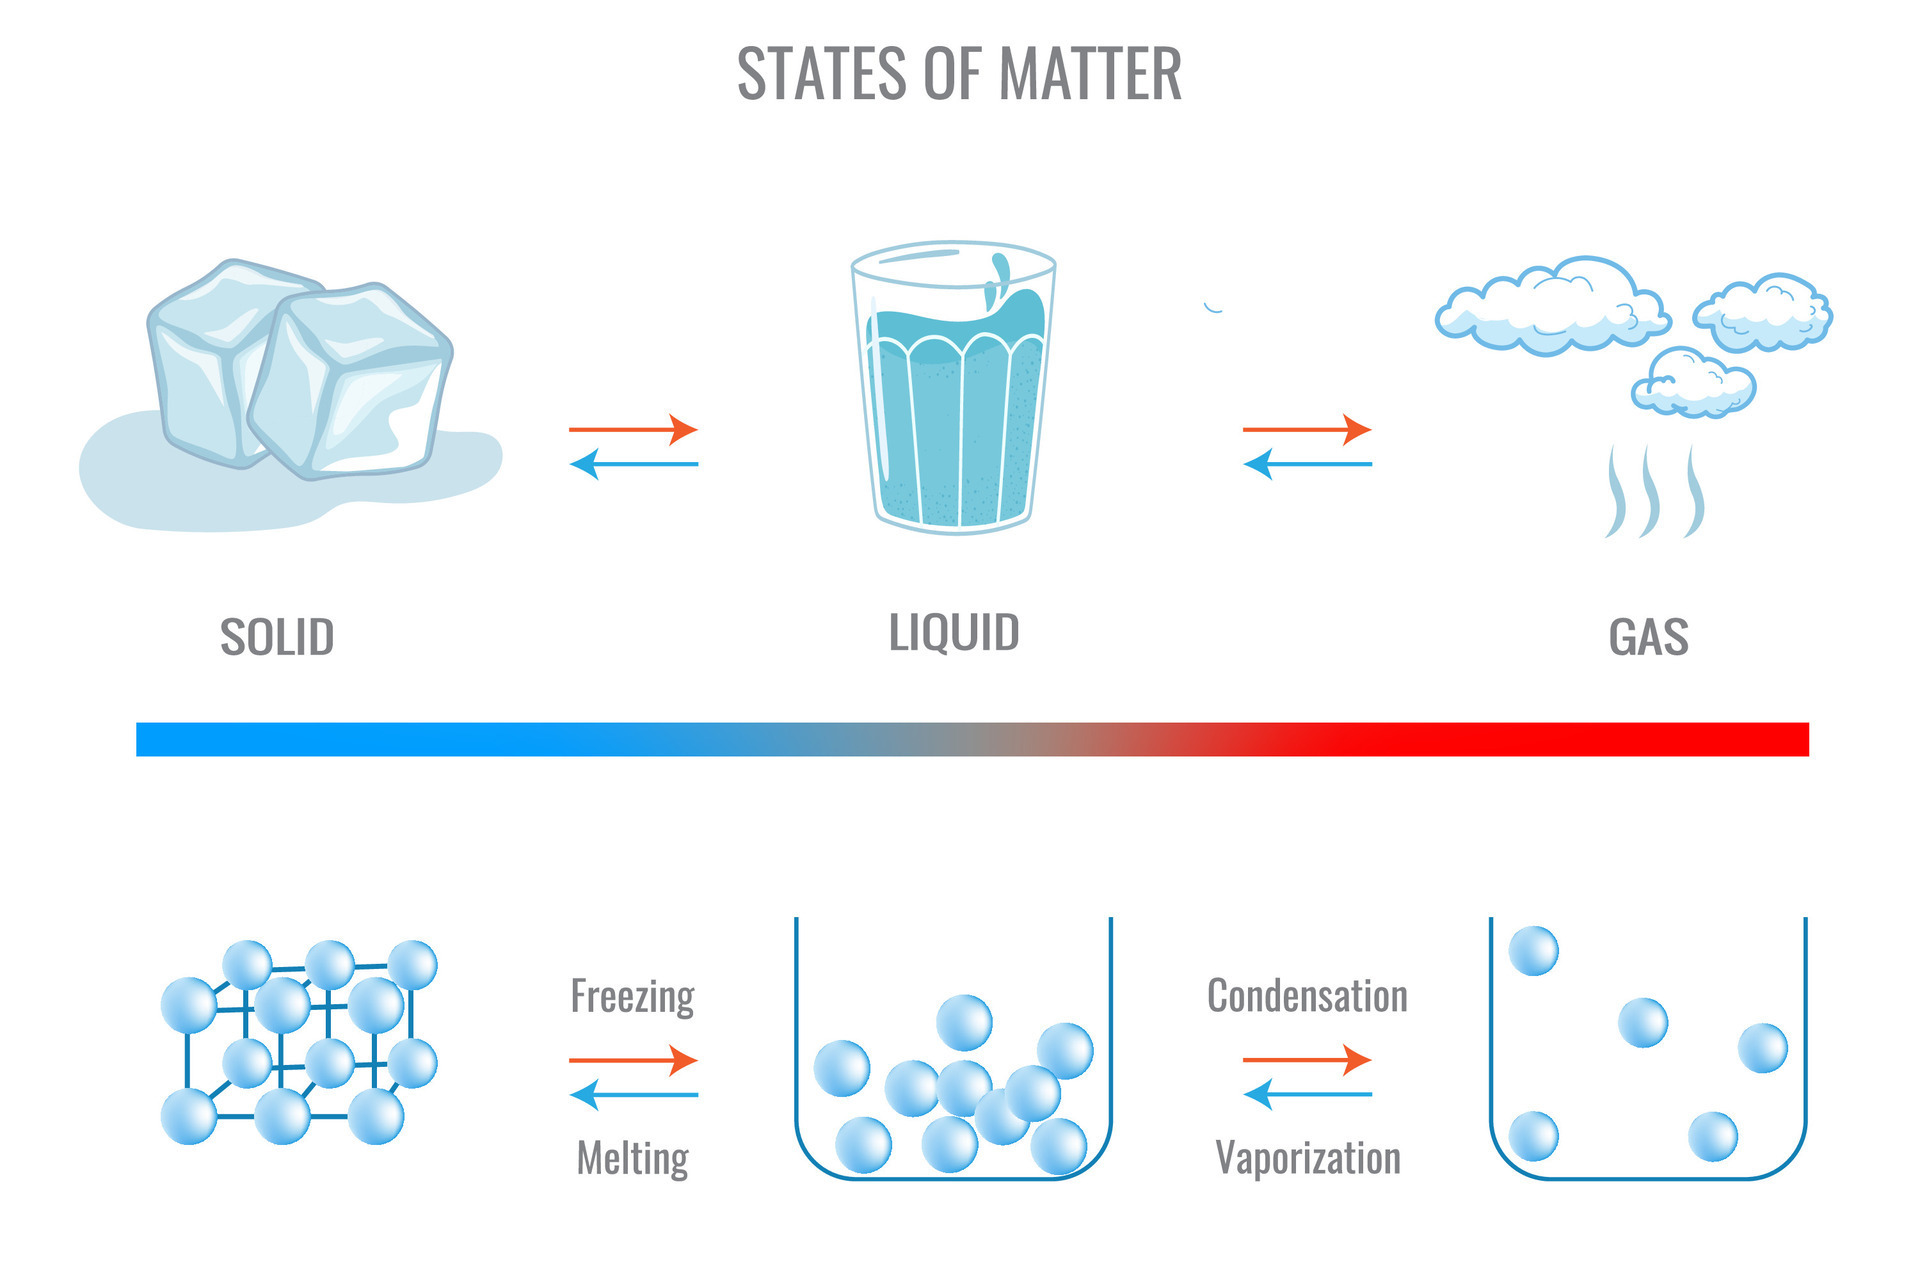
Core Physical Principles Behind Methane Detection
Most methane measurement systems work because methane molecules absorb infrared radiation at characteristic wavelengths, particularly around 1.6 and 3.3 micrometers. When sunlight passes through the atmosphere, instruments compare the incoming solar spectrum with the attenuated spectrum after interaction with air, then infer methane column density from the depth of absorption features.
High-precision instruments such as cavity ring-down spectrometers, open-path lasers, and satellite-borne spectrometers exploit these fingerprints to resolve concentration differences of less than 1 part per billion (ppb) in controlled conditions. Real-world airborne and space-based systems often target 1-10 ppb per pixel, trading ultimate precision for spatial coverage and operational robustness.
Satellite-Based Monitoring and Global Coverage
Satellite instruments provide the broadest "top-down" view of atmospheric methane, scanning millions of square kilometers per day. Missions such as TROPOMI on the European Space Agency's Sentinel-5P, the Environmental Defense Fund's MethaneSAT, and GHGSat's commercial constellation each use push-broom or imaging spectrometers to construct column-density maps of methane across active oil and gas basins, agricultural regions, and landfill zones.
For example, MethaneSAT began routine operations in March 2025 and can image methane "plumes" across footprints roughly 250 km by 300-400 km at ~1-km resolution, correlating observed anomalies with known infrastructure and weather data. Independent analyses suggest that by mid-2025 such systems had cataloged over 10,000 high-magnitude "super-emitter" events globally, collectively accounting for roughly 15-25% of measured sectoral methane releases.
- High-resolution broadband spectrometers (e.g., TROPOMI) that scan large swaths with moderate resolution but high revisit frequency.
- Narrow-field, high-resolution imagers (e.g., GHGSat, MethaneSAT) that zoom into specific production regions or cities to pinpoint individual facilities.
- Constellations of small-satellite sensors designed to provide frequent, low-latency alerts for rapid response by regulators or operators.
Ground-Based Sensors and Field Instruments
On the ground, methane detection spans from handheld sniffers to permanently installed sensor networks. Catalytic bead and electrochemical sensors give low-cost, localized alarms, while tunable diode laser absorption spectroscopy (TDLAS), open-path systems, and cavity-ring-down devices deliver parts-per-billion accuracy at fixed sites or along facility perimeters.
Many industrial operators now deploy 24/7 fixed-sensor networks around compressor stations, processing plants, and waste-management facilities, transmitting data in near-real time to central monitoring centers. Academic and regulatory networks such as NOAA's Global Greenhouse Gas Reference Network use similar hardware at ~30 globally distributed tall towers to track long-term atmospheric trends.
Aircraft and Drone-Borne Systems
Aircraft and drones equip lasers, lidars, and in-situ analyzers to fly transects or orbit specific sites, generating "mass-balance" estimates of basin-wide emissions or "stack-up" tallies for individual fields. These systems have become standard for regulatory verification campaigns and operator-led emissions inventories, especially over oil and gas regions such as the Permian Basin.
Recent studies using airborne lidar indicate that beneath the layer monitored by large-footprint satellites, hundreds of smaller but persistent sources-often forgotten or poorly documented infrastructure-can add up to 10-20% of regional emissions. For instance, a 2024 campaign over the U.S. shale belt resolved over 1,200 previously undetected moderate-rate leaks in just three weeks of flight operations.
Modeling and "Bottom-Up" versus "Top-Down" Approaches
Beyond direct measurements, emissions modeling combines activity data (e.g., number of wells, livestock headcounts, landfill tonnage) with emission-factor estimates to produce "bottom-up" inventories. These are then compared with "top-down" satellite and aircraft observations, creating a feedback loop that has repeatedly revealed under-reporting of between 20% and 50% in certain national inventories.
In 2023, the Global Carbon Project highlighted that reconciling satellite-derived basin-level methane fluxes with bottom-up inventories reduced uncertainty in global annual methane budgets by roughly 30%, helping governments refine mitigation strategies and prioritize sectors and regions.
Real-World Detection Limits and Performance Benchmarks
Different methane monitoring technologies have characteristic detection limits and temporal resolutions. For illustration, consider the following indicative ranges:
| Technology | Typical detection limit (emission rate) | Typical resolution / frequency |
|---|---|---|
| Low-cost handheld sensors | ~100-500 kg/h plume | Spot checks, minutes |
| Fixed-site laser analyzers | ~10-50 kg/h at site scale | Continuous, sub-hourly |
| Aircraft mass-balance | ~1-10 t/h basin-wide | Campaigns, hourly to daily |
| GHGSat-class satellites | ~100-200 kg/h per pixel | Weekly to daily, 10-50 m pixels |
| MethaneSAT-style mappers | ~10-50 kg/h over 1-km² cells | Every 2-3 days, 1-km grids |
These performance envelopes show why practitioners combine methods: handheld and ground sensors localize leaks, aircraft integrate them into basin totals, and satellites provide persistent, global surveillance.
Alert Systems and Operational Response
New methane alert platforms such as the United Nations Environment Programme's Methane Alert and Response System (MARS) fuse satellite detections, weather forecasts, and facility databases to flag suspected super-emitters within hours of overpass. MARS, operational across more than 100 countries by mid-2025, issues alerts to national authorities and, with consent, to individual companies, frequently prompting repairs within days.
Industry-run monitoring centers, such as ExxonMobil's Center for Operations & Methane Emissions Tracking in Houston, integrate data from satellites, aircraft surveys, and 24/7 fixed-site networks to triage anomalies and dispatch field crews. Early adoption of these integrated systems has been associated with field-level leak-repair rates improving by roughly 35-50% over traditional inspection cycles.
Challenges and Limitations in Current Monitoring
Even with advanced sensors, methane detection faces persistent challenges. Cloud cover, low solar angles, and instrument noise can obscure satellite signals, while small, intermittent leaks-often below 10-50 kg/h-frequently evade detection thresholds of current satellite payloads. In addition, accurate quantification still depends heavily on ancillary data such as wind speed, boundary-layer height, and surface roughness.
Studies released in early 2026 indicate that roughly 25-40% of regional emission budgets remain "unattributed" because they arise from diffuse, low-rate sources (e.g., scattered agricultural practices, small landfills, or poorly documented infrastructure). Efforts to close this gap increasingly rely on tighter integration between satellite snapshots, frequent airborne surveys, and dense ground-sensor networks.
Emerging Innovations and Next-Generation Systems
Next-wave methane monitoring technologies include miniaturized lidar and gas-imaging payloads for small drones, multi-sensor "electronic nose" arrays that disentangle methane from other hydrocarbons, and advanced quantum-cascade-laser spectrometers capable of continuous operation in harsh field conditions. In 2025, the National Institute of Standards and Technology (NIST) upgraded its frequency-comb system to measure methane and ethane year-round even in Arctic temperatures, signaling a trend toward more robust, calibration-anchored field devices.
Several research teams are also developing AI-driven plume-tracking algorithms that ingest satellite, aircraft, and ground data to automatically attribute emissions to specific facilities or even equipment classes. Early prototypes tested in 2024-2025 achieved attribution accuracy exceeding 80% for major oil and gas basins, vastly simplifying the task of regulatory enforcement and corporate accountability.
Uses of Methane Monitoring Data in Policy and Industry
At the policy level, methane observations inform national inventories, climate pledges, and cross-border emissions agreements. The Global Methane Pledge, launched in 2021 and now encompassing over 150 countries, explicitly cites satellite-derived plume catalogs and basin-level flux estimates as key tools for verifying progress toward a 30% emissions cut by 2030.
In industry, operators increasingly treat methane data as a core operational metric alongside production and safety figures. Integrated monitoring platforms feed real-time dashboards showing leak rates, repair status, and estimated mitigation benefits, enabling operators to optimize inspection schedules and prioritize capital upgrades. Independent analyses suggest that firms employing advanced monitoring suites have reduced facility-level methane intensity by 20-40% over five-year periods.
Practical Examples of Monitoring in Action
Since 2022, several large energy companies have conducted multi-year campaigns using aircraft and satellite data to inventory emissions across the Permian and Bakken basins. In 2024, a joint study by Stanford and oil producers reported that frequent airborne surveys cut the average time between leak occurrence and repair from ~14 days to under 5 days, slashing cumulative emissions by an estimated 25-35% without changing overall production.
On the municipal side, landfill operators using perimeter-line sensors and drone-mounted lidars have begun to correlate methane spikes with specific cell operations or waste-handling activities. One European case study from 2025 showed that targeted gas-collection upgrades, guided by months of continuous sensor data, reduced fugitive methane from a major landfill by roughly 50% within two years.
Key Takeaways for Stakeholders
For regulators, the move toward integrated methane verification systems means that unreported or "hidden" emissions are increasingly visible, with repeatable, auditable data streams. For operators, early-adopting monitoring suites can turn methane from a liability into a guidebook for operational efficiency and risk reduction. For the public and investors, ubiquitous alerts and open-data portals provide a new window into whether climate-pledge commitments translate into measurable emission declines.
As satellite revisit rates improve, AI-driven analytics evolve, and lower-cost sensors proliferate, the practical answer to "how methane is monitored in the atmosphere" will increasingly converge on a single phrase: in near-real time, with accelerating precision, and at scales that couple global security to local accountability.
Expert answers to Methane In Atmosphere How Tracking Really Works queries
What are the main types of satellite sensors used for methane?
Three primary sensor architectures dominate space-based methane observation:
How do continuous ground sensors differ from spot-check methods?
Continuous ground sensors operate unattended over hours to years, logging data at intervals from seconds to minutes, whereas spot-check methods such as handheld optical gas imaging (OGI) cameras or mobile surveys capture short-duration snapshots around specific equipment or facilities. Continuous systems excel at identifying persistent leaks and diurnal patterns; spot-check tools are better for rapid leak detection and repair (LDAR) prioritization.
How quickly can a methane leak be detected and acted on?
With modern monitoring infrastructure, a large blowout can be visible to satellites within hours; alerts may reach operators or regulators within 6-24 hours, depending on data processing and notification protocols. Once alerted, mobile ground teams equipped with handheld optical gas imagers can typically locate and quantify the source within a few hours, enabling repairs or mitigation within 24-72 hours in many cases.
Can satellites detect very small methane leaks?
Most current satellite systems focus on moderate- to high-rate leaks; small, intermittent releases often fall below their detection thresholds. For example, GHGSat's commercial sensors typically report detection limits around 100-200 kg/h per pixel under ideal conditions, while MethaneSAT-style mappers may resolve 10-50 kg/h when integrating over 1-km² areas. Truly small leaks-on the order of 1-10 kg/h-usually require ground-based or airborne sensors, though future ultra-high-resolution constellations aim to narrow this gap.
How long has methane been systematically monitored?
Continuous, instrumented methane monitoring began in earnest with the 1970s deployment of baseline atmospheric sampling networks, such as those later formalized by NOAA and the World Meteorological Organization. Systematic space-based methane observation only became routine in the mid-2010s with instruments like GOSAT and IASI, and high-resolution emission-mapping satellites such as MethaneSAT entered service in 2025, marking a generational leap in monitoring capability.